Create and edit charts
If you want to use different charts, you can create them directly in the management report or you can choose one or more charts form the drop-down menu.
How to edit the content on the dashboard
To change any of the lines in the table or the paragraphs, you need to go to Dashboards » Settings to add or remove lines in the dashborad. You must have at least one group in the dashboard in order to show lines.
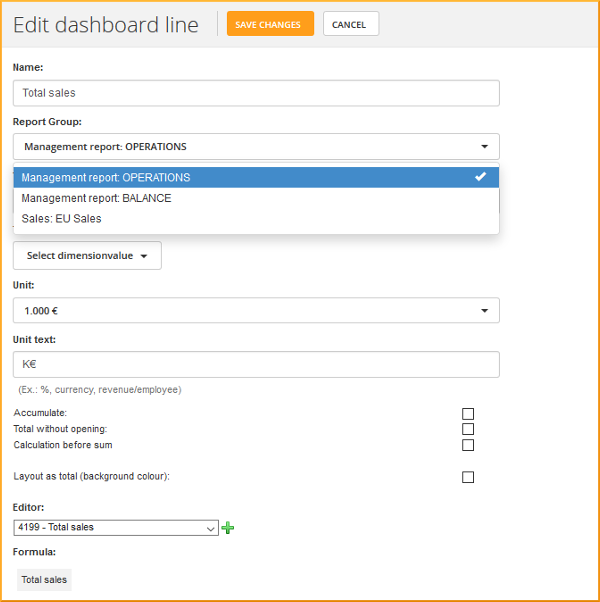
If you want to edit some of the key figures already shown in the report, you have to click on the name and make your changes in the window that appears. When you have saved it, you automatically go back to the report.
How to use dimensions on your dashboards
If you are using Dimensions, you can select the value on the dashboard. You'll find the drop-down list to the right of the orange button [Create chart].
You can also tie the content of each line on the dashboard to a dimension or a combination of dimensions.
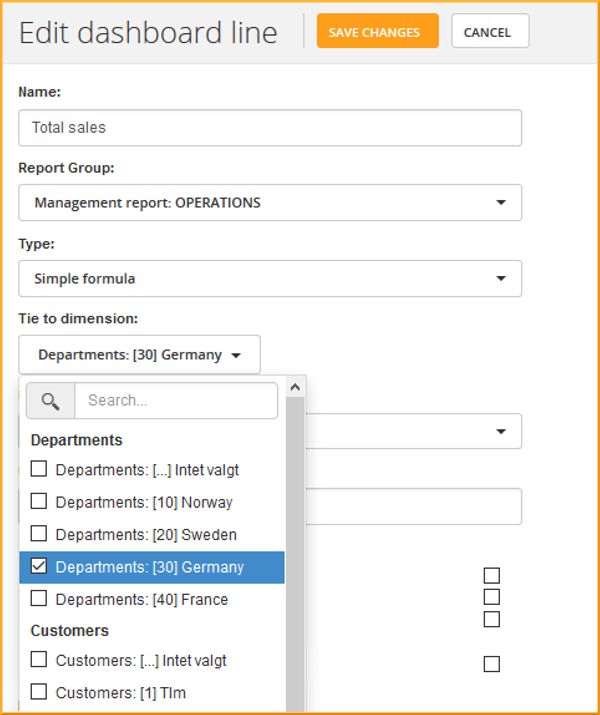
By limiting a dashboard line to one or more specific dimensions, it becomes easy to set up comparisons or calculations.
For example, you can present your departments' respective turnovers in separate lines, while the costs appear as a sum for the entire company. You can also calculate a department's share in the turnover in the dashboard line and then use this to divide the costs between departments.
If a dashboard line is not tied to a dimension, the line's values automatically follow the selections you have made in the dimension selector at the top of the page.